

By Cooper Timberman and Jeshal Patel
Introduction
Buying a stock can take only a few taps, but deciding whether it is worth considering takes research. Platforms like Robinhood display prices, charts, and company statistics, yet those numbers do not automatically explain whether a business is financially healthy or what could affect its future.
Many Georgia Tech students know brands such as Apple, Microsoft, and Tesla without knowing how to evaluate them as investments. A familiar product, impressive stock chart, or trending social media post does not necessarily mean a company is a good investment. Without understanding what to look for, beginners may make decisions based on popularity rather than reliable financial information.
This guide offers a seven-step process for researching a publicly traded company. You will learn how to understand its business model, check its financial performance, interpret basic stock metrics, analyze historical prices, research company news, and identify potential risks. Along the way, screenshots, visual examples, and infographics will help explain important concepts.
You do not need a finance background or brokerage account to start. The purpose is to develop financial literacy and a repeatable research process, not to recommend specific stocks or teach trading. By the end of this guide, you should have a clearer understanding of what information matters when evaluating a company and where to find it.
Step 1: Choose a Company to Research
Find a Company and Its Stock Ticker
Start with a publicly traded company you recognize or want to learn about. Choosing a familiar business can make its products and customers easier to understand.
- Open a public stock information website, such as Robinhood.
- Search for the company by its name.
- Confirm the company identity and ticker symbol.
- Write down the company name and ticker for later research.
A ticker symbol is the short identifier used for a security on an exchange. Apple, for example, uses AAPL. Double-check the company name because similar names and ticker symbols can refer to different businesses. Familiarity is a starting point, not evidence that a stock is attractive.

Step 2: Understand the Company’s Business Model
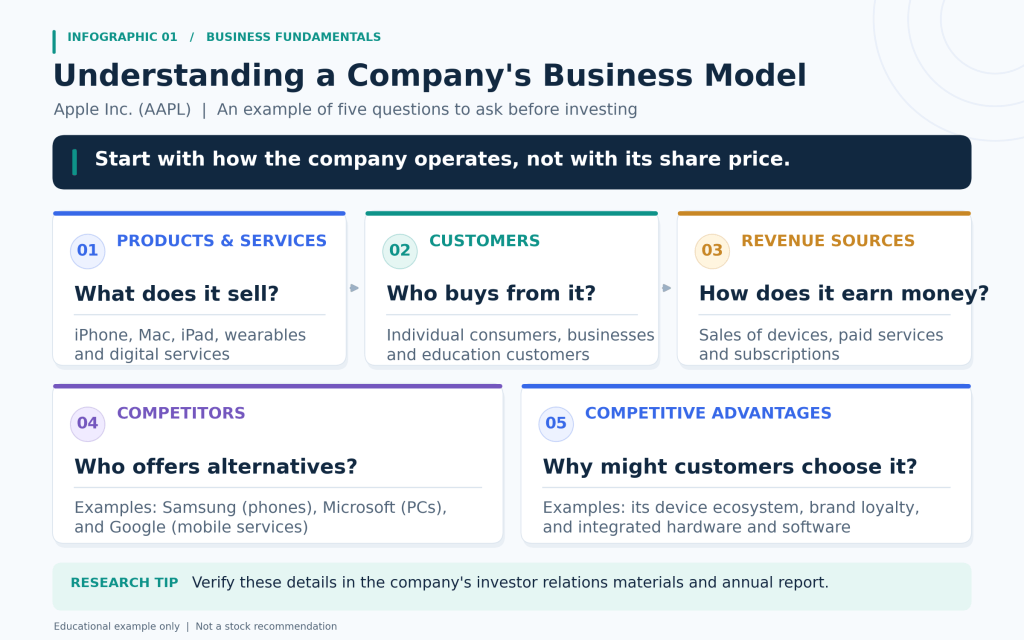
Before examining stock prices, understand what the company actually does and how it earns money. A business model explains how a company provides products or services to customers and generates revenue from those activities.
Products, Customers, and Revenue Sources
Begin by answering three basic questions about the business:
- What are the company’s main products or services?
- Who are its primary customers?
- How does the company generate most of its revenue?
For example, a technology company might generate revenue through hardware sales, software subscriptions, or advertising. Understanding these sources helps explain which activities contribute to the company’s overall performance.
Competitors and Competitive Advantages
Next, identify the company’s major competitors and consider what makes it different. Competitive advantages might include brand recognition, technology, customer loyalty, or lower production costs. A company may have popular products but still face significant competition.
Useful resources include the company’s official website, investor relations page, and annual report. You can also use the SEC’s EDGAR database to locate publicly available company filings. Try summarizing the company’s business model in two or three sentences before continuing.
Step 3: Review the Company’s Financial Health

Once you understand the business, examine its financial performance. Financial information can reveal whether a company is growing, earning profits, generating cash, and managing its obligations.
Key Financial Measures to Examine
Focus on these four financial measures:
- Revenue: The money a company earns from selling products or services.
- Net income: The profit remaining after expenses and applicable taxes.
- Operating cash flow: Cash generated or used through normal business operations.
- Debt: Money the company owes to lenders and other creditors.
These measures provide different perspectives on financial health. For example, a company might report growing revenue while experiencing declining profits because its expenses are increasing.
Compare Financial Results Over Time
Review financial results across several years instead of judging the company based on one quarter. Look for trends in sales, profitability, cash flow, and debt. Consistent improvement may indicate progress, while declining results may require additional investigation.
Annual reports and quarterly filings provide detailed financial statements. The SEC’s guide to reading Form 10-K explains where to find financial information and management’s discussion of company performance.
Step 4: Learn the Meaning of Basic Stock Metrics

Stock metrics help investors understand a company’s size, profitability, and valuation. Learning a few common metrics makes it easier to compare businesses and interpret the information displayed on financial websites.
Market Cap, EPS, P/E Ratio, and Revenue Growth
- Market capitalization: The total market value of a company’s outstanding shares.
- Earnings per share (EPS): The company’s earnings attributable to each outstanding common share.
- Price-to-earnings ratio (P/E): The stock’s share price divided by its earnings per share.
- Revenue growth: The percentage increase or decrease in company sales over a particular period.
For example, a P/E ratio of 20 means investors are paying approximately $20 for every $1 of annual earnings per share used in that calculation. However, a higher P/E ratio does not automatically mean a stock is overpriced, and a lower ratio does not guarantee a bargain.
Compare these metrics with previous years and with similar companies in the same industry. Differences in growth expectations, profitability, and business conditions can help explain why companies have different valuations.
Step 5: Analyze Stock Performance Over Time

A stock’s price can change significantly over days, months, or years. Examining historical performance helps put recent price movements into context and identify periods of volatility.
Review Historical Stock Charts
- Open the company’s stock chart on a financial website.
- View multiple time periods, such as one month, one year, and five years.
- Identify major increases, declines, and periods of volatility.
- Investigate significant events that occurred during those periods.
For example, a stock may decline after disappointing earnings or increase following a major product announcement. However, broader market conditions can also influence stock prices, so avoid assuming that one event explains every price movement.
Compare Performance With the Market
Compare the stock’s performance against an appropriate market index, such as the S&P 500, or similar companies. This can help determine whether its performance is unusual or reflects broader market trends.
Remember that past performance does not guarantee future results. A rising stock price alone does not prove that a company is financially strong or fairly valued.
Step 6: Research Recent Company News and Industry Trends
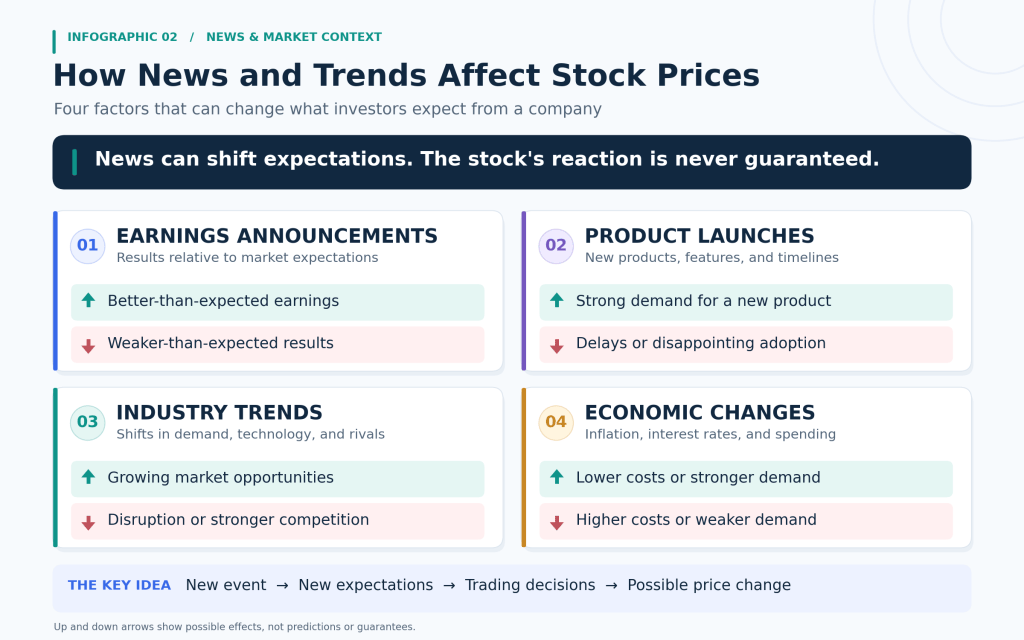
Financial statements describe past performance, but company news and industry developments can provide context about current challenges and future opportunities. Product launches, earnings announcements, regulatory changes, and economic conditions can all influence investor expectations.
Find and Verify Company News
- Search for recent news about the company.
- Check the publication date of each article.
- Review official company announcements and earnings releases.
- Compare important claims against multiple credible sources.
Prioritize original sources whenever possible. For example, an official earnings report is generally more reliable for reported company financial results than an unsupported social media post. Be careful to distinguish confirmed information from predictions or opinions.
Understand Industry and Economic Trends
Consider external factors that could affect the company’s future. A technology business might be influenced by changing demand for artificial intelligence, while a retailer might be affected by consumer spending and supply costs.
Research both positive and negative developments. FINRA’s stock investing and due diligence guide explains why examining a company’s competitors, industry, and financial information matters when evaluating an investment.
Step 7: Identify Potential Risks
Every investment involves uncertainty. Before considering a stock, identify risks that could negatively affect the company’s operations or share price. Understanding these risks helps you evaluate potential downsides rather than focusing only on opportunities.
Evaluate Company-Specific Risks
Consider the following questions:
- Does the company have significant debt?
- Is it facing strong competition?
- Does it depend heavily on one product, customer, or market?
- Could new laws or regulations affect its business?
- Has its stock price experienced unusual volatility?
- Are revenue or profitability declining?
A useful place to investigate these concerns is the Risk Factors section of the company’s annual 10-K filing. Try identifying two or three major risks associated with the company you researched.
Consider Investment and Market Risks
Individual companies are also affected by broader economic conditions. Market downturns, interest rates, inflation, and changing investor expectations can influence stock prices even when a company’s underlying business remains relatively stable.
Investing heavily in a single company creates additional exposure to problems specific to that business. The SEC’s guide to asset allocation and diversification explains how spreading investments across different assets and companies can help manage risk.
Understanding potential risks is just as important as recognizing possible opportunities. Research cannot eliminate uncertainty, but it can help you make more informed decisions.
Conclusion
A video tutorial on ways you can implement some of the steps above is linked here: Video Link
Researching a stock involves much more than checking its current price. By following these seven steps, you can develop a clearer understanding of a company’s business model, financial health, valuation, historical performance, and potential risks.
The most important habit is to verify information and examine multiple sources before forming a conclusion. No individual statistic, chart, or news article can tell the complete story of an investment. Practicing this process with different companies can help you become more confident in evaluating financial information and recognizing important patterns.
Disclaimer: This guide is intended for educational purposes and does not provide personalized financial advice.


Leave a Reply